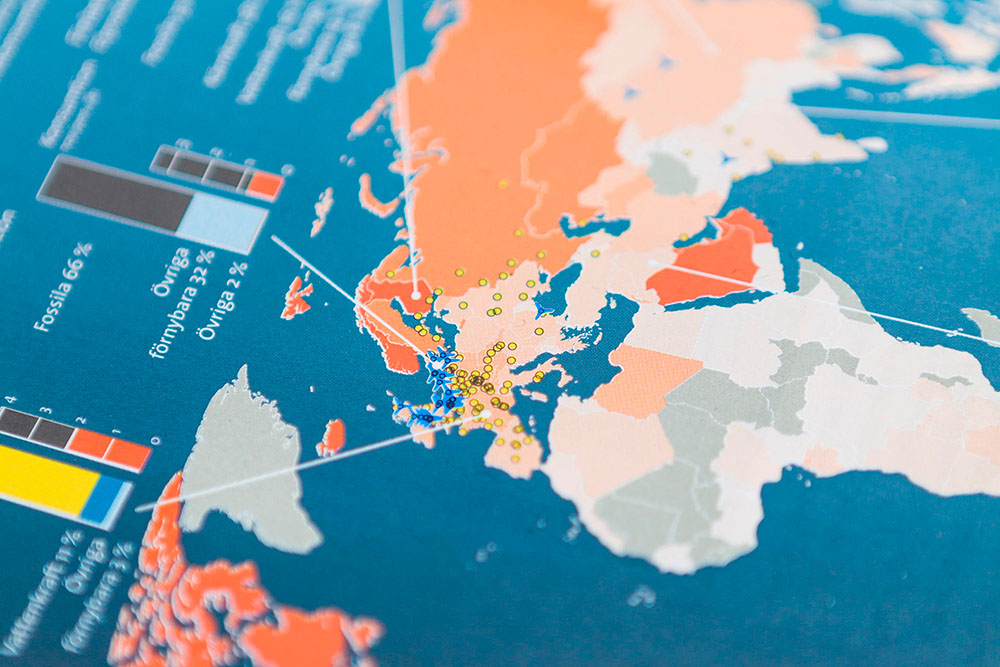
This visualization utilizes open data provided by Fintraffic through a Digitraffic service. The API used for this visualization provides AIS (Automatic Identification System) -information on vessel locations in Finnish waterways. Area of observation is delimited to cover the surroundings of City of Helsinki.
Work
Here is a selection of our projects done with different
clients over the years.
Click the thumbnail
to view and explore a project in detail. →
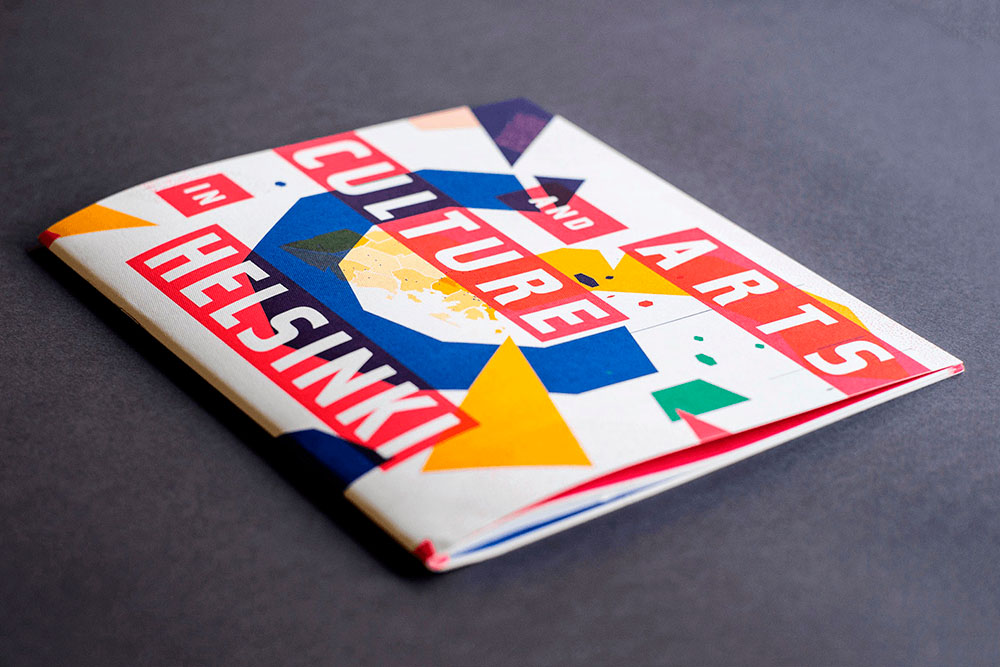
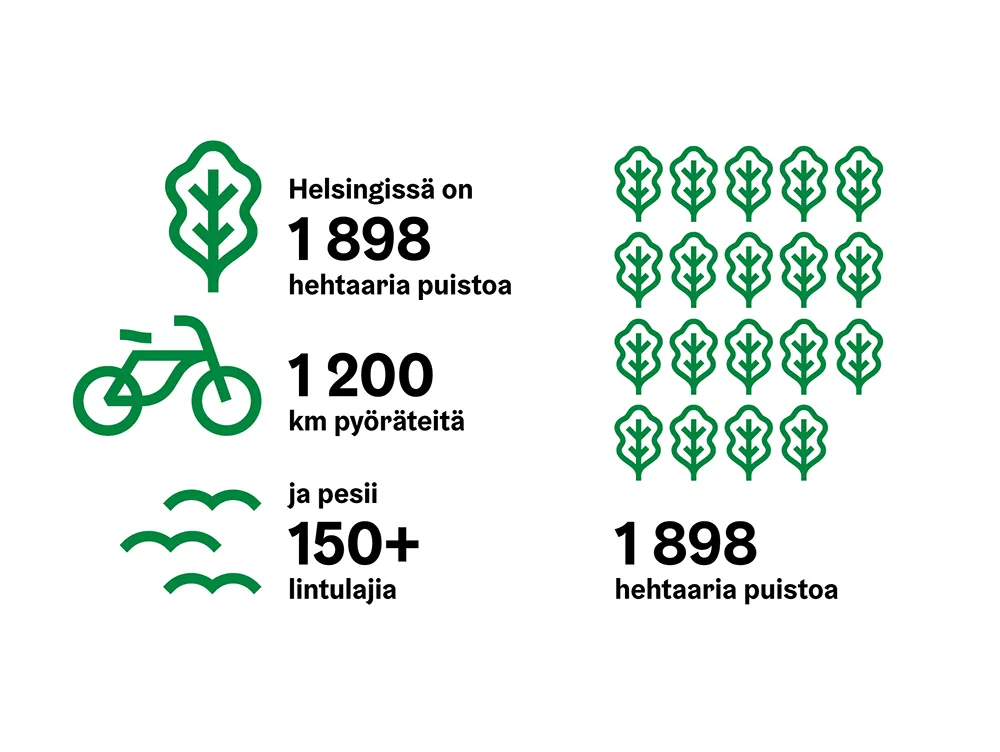
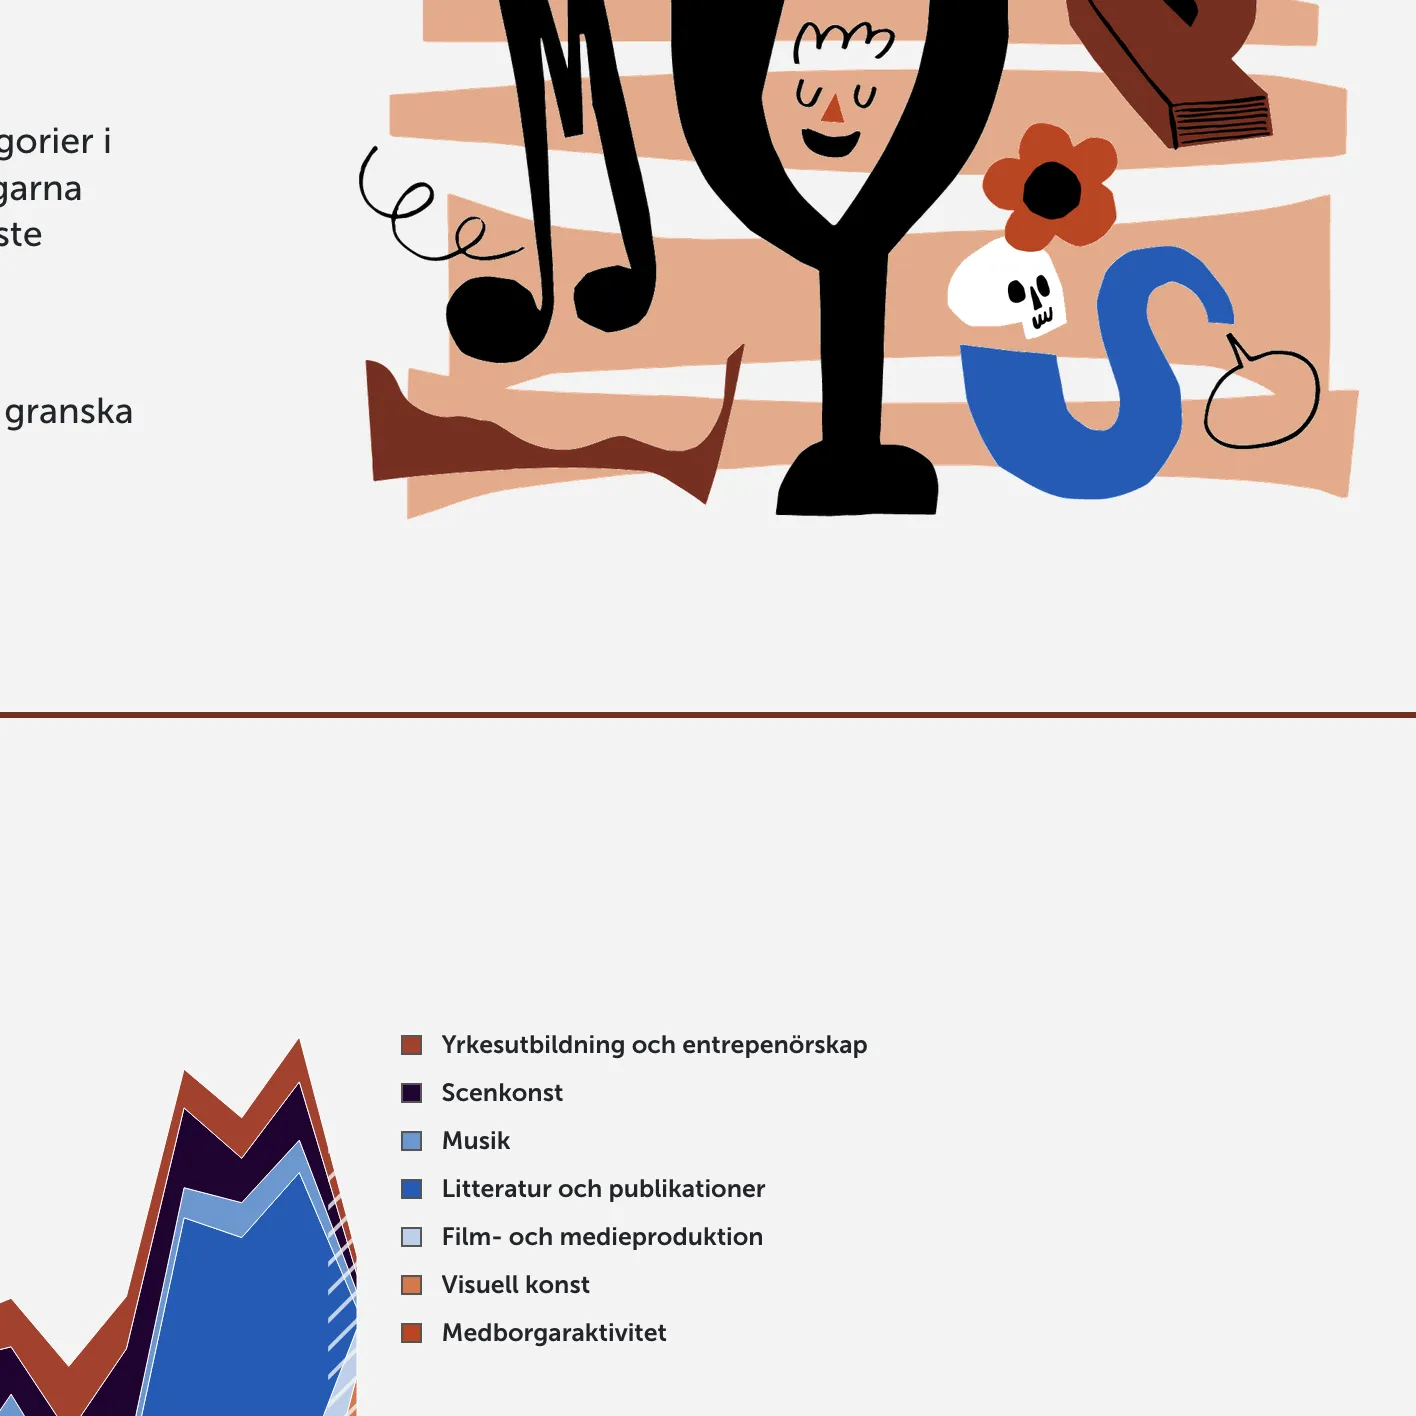
Arts and Culture in Helsinki
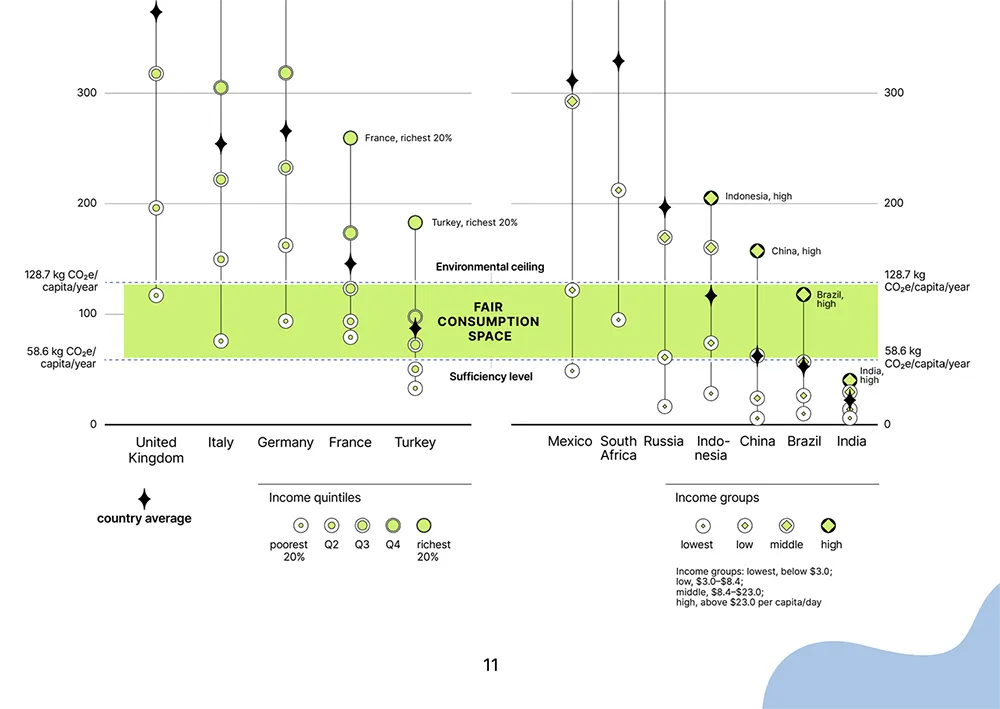
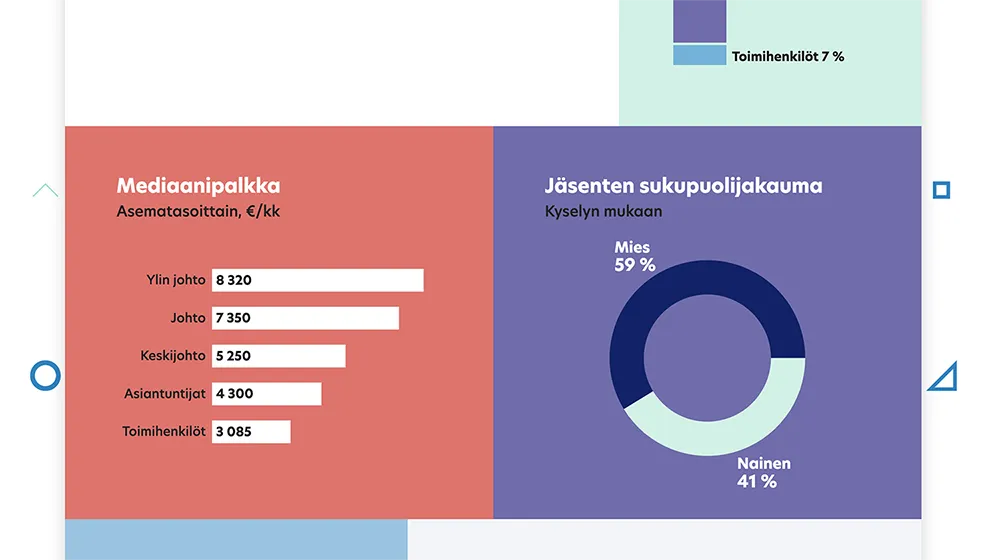
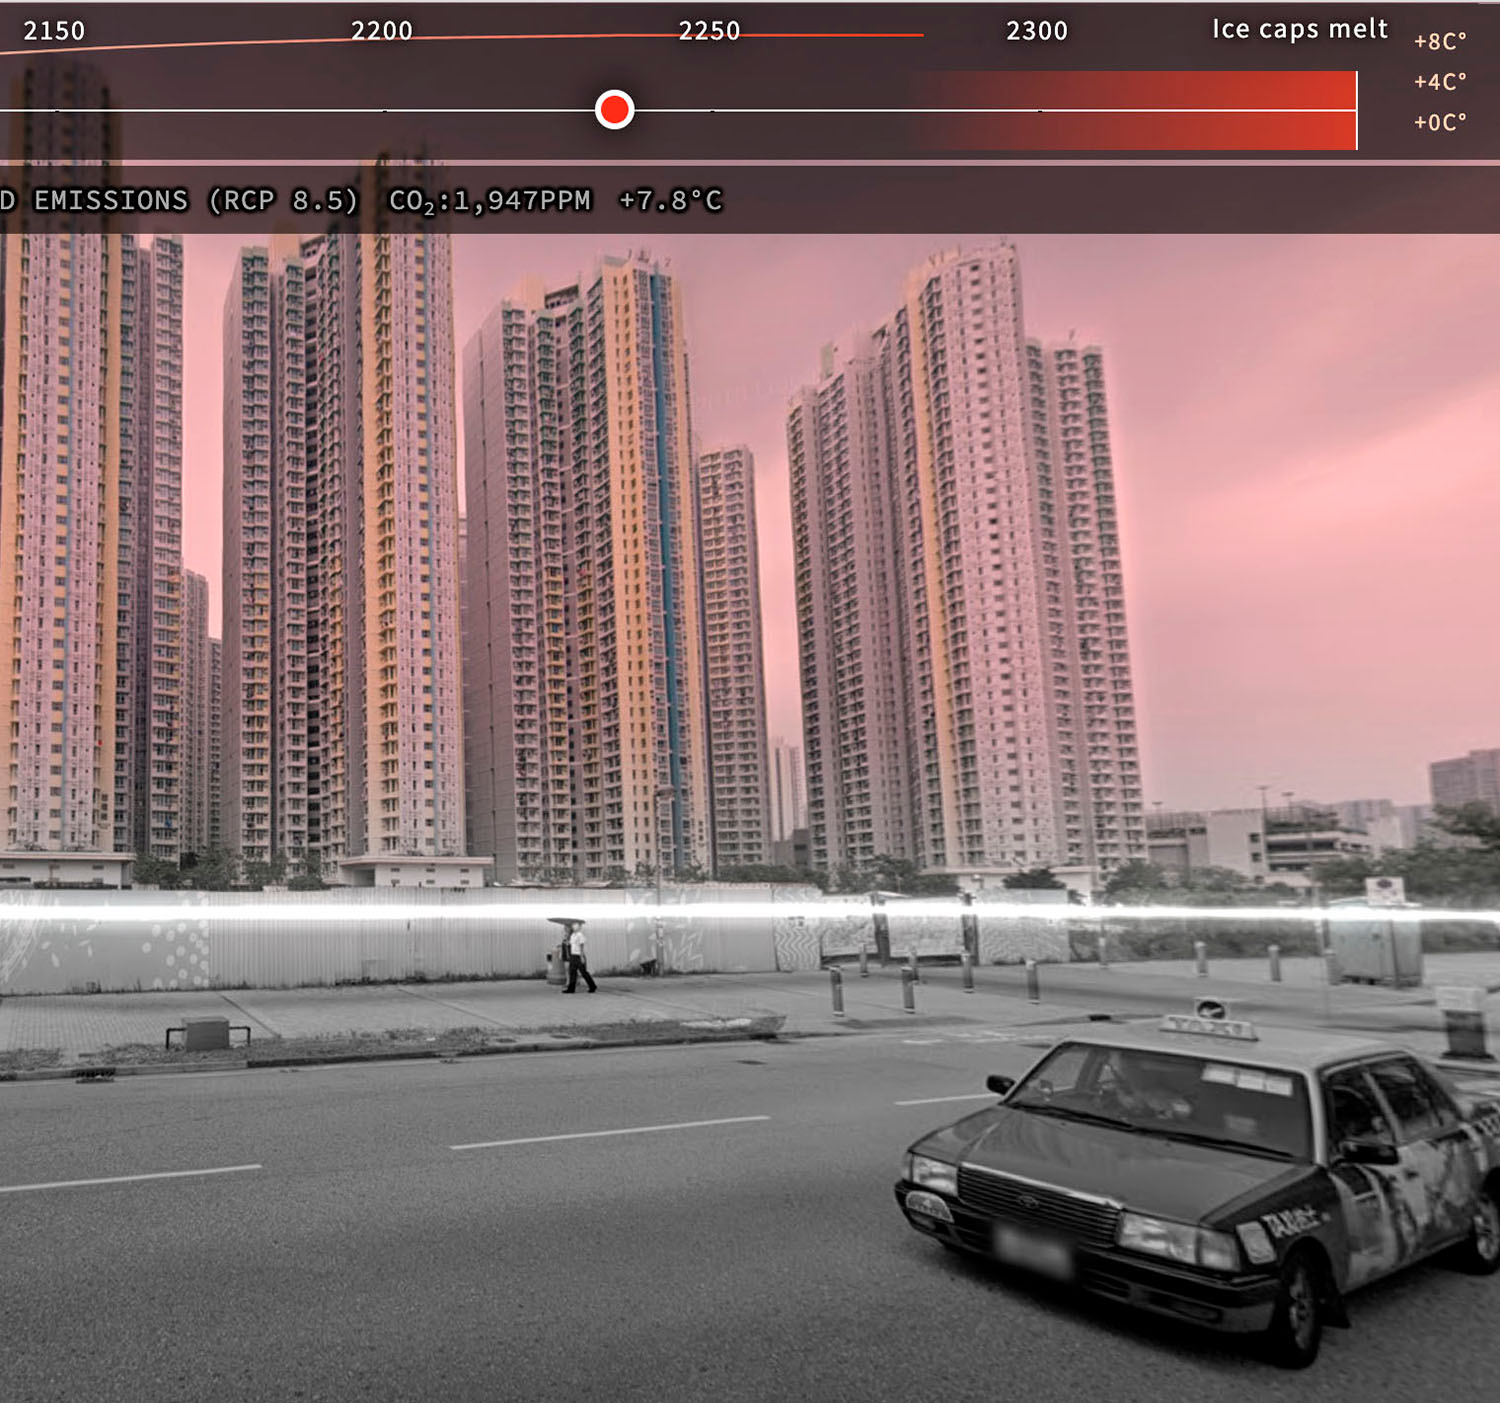
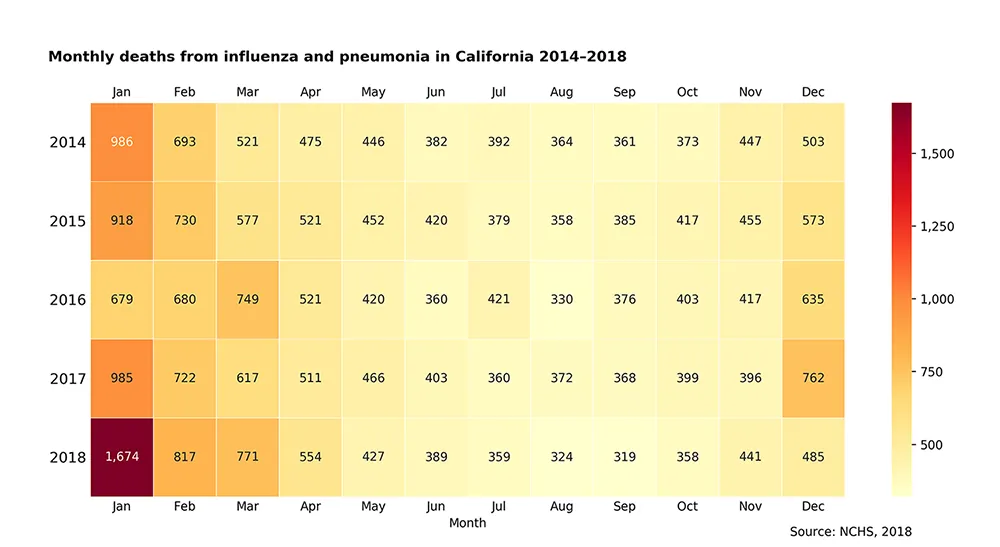
Selected infographics
Manner geography textbooks
YTN Data
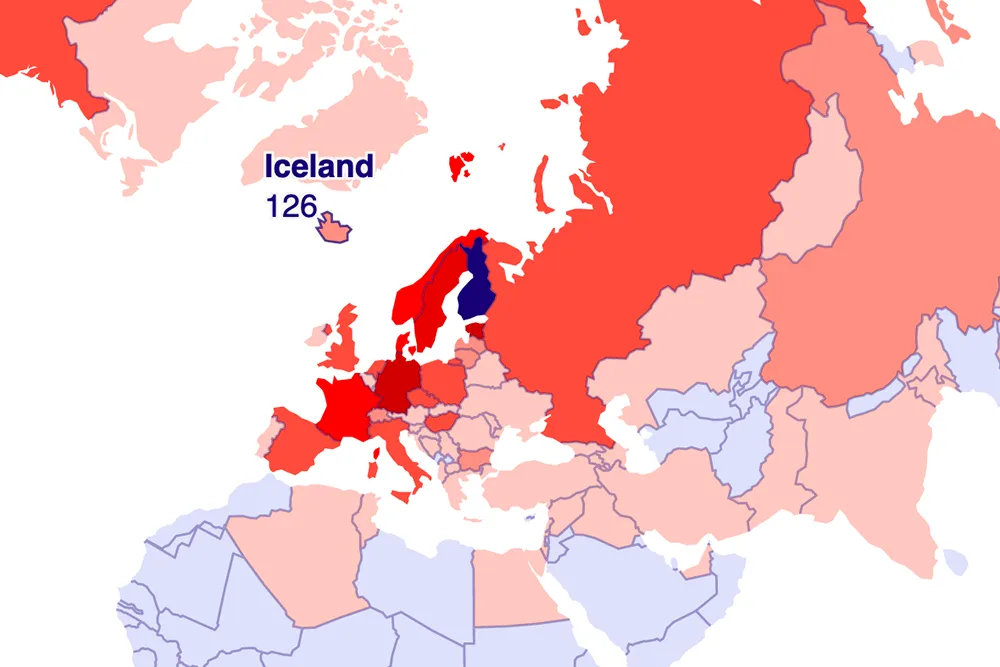
Coastline Paradox
City of Helsinki infographics guidelines
SAGE Datasets
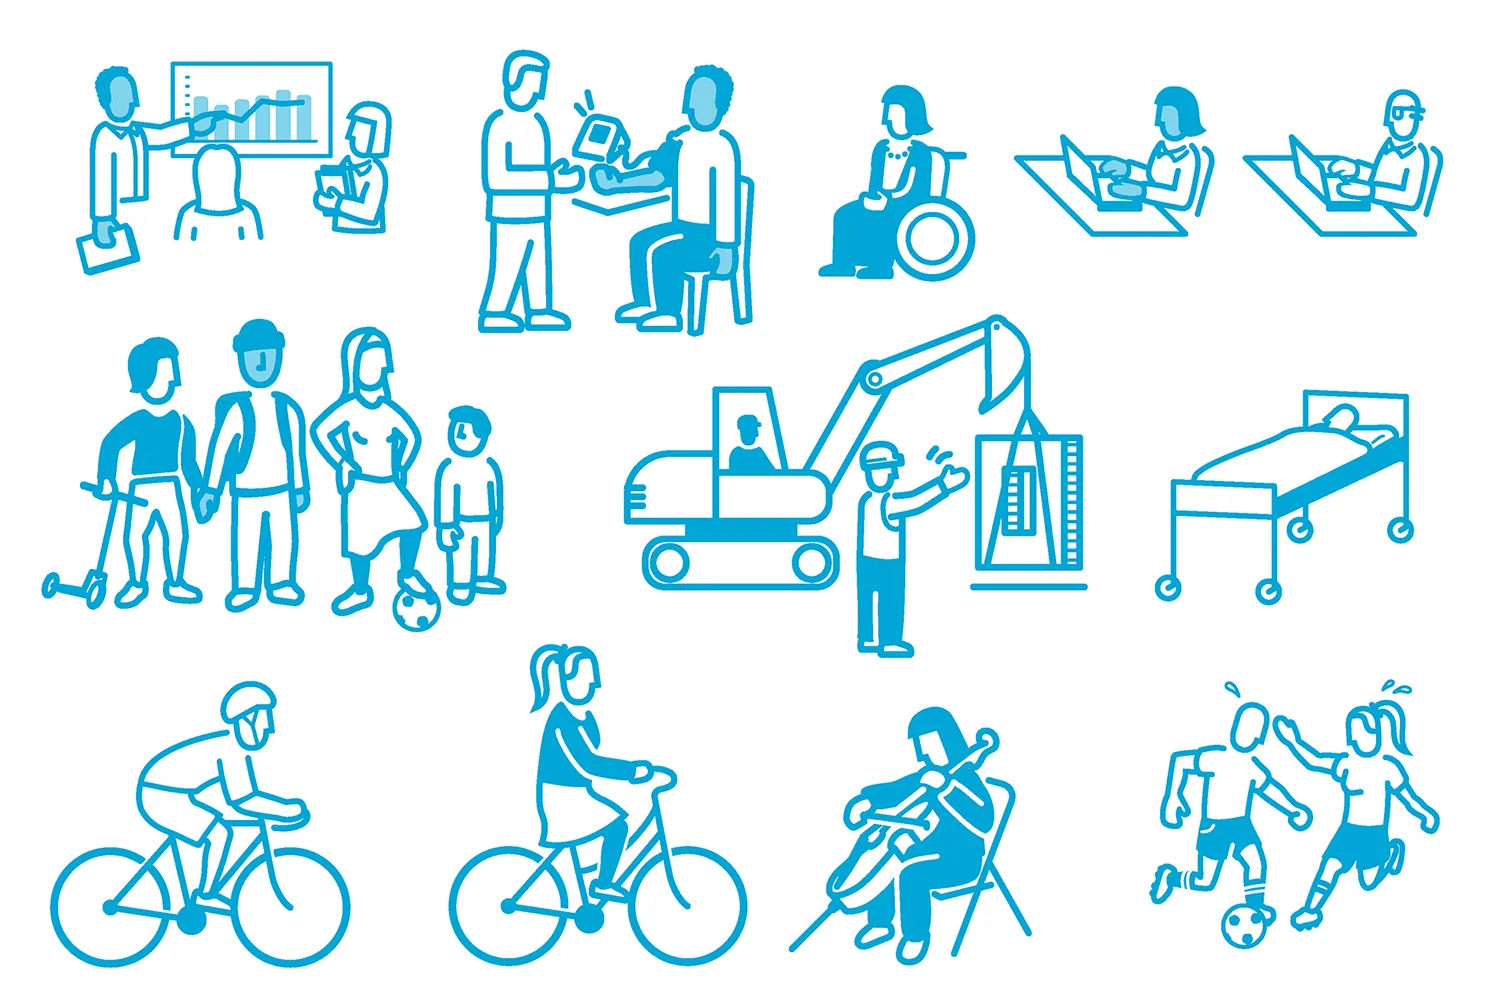
Pictograms for Kuntaliitto
Amos Anderson Fund grant dashboard
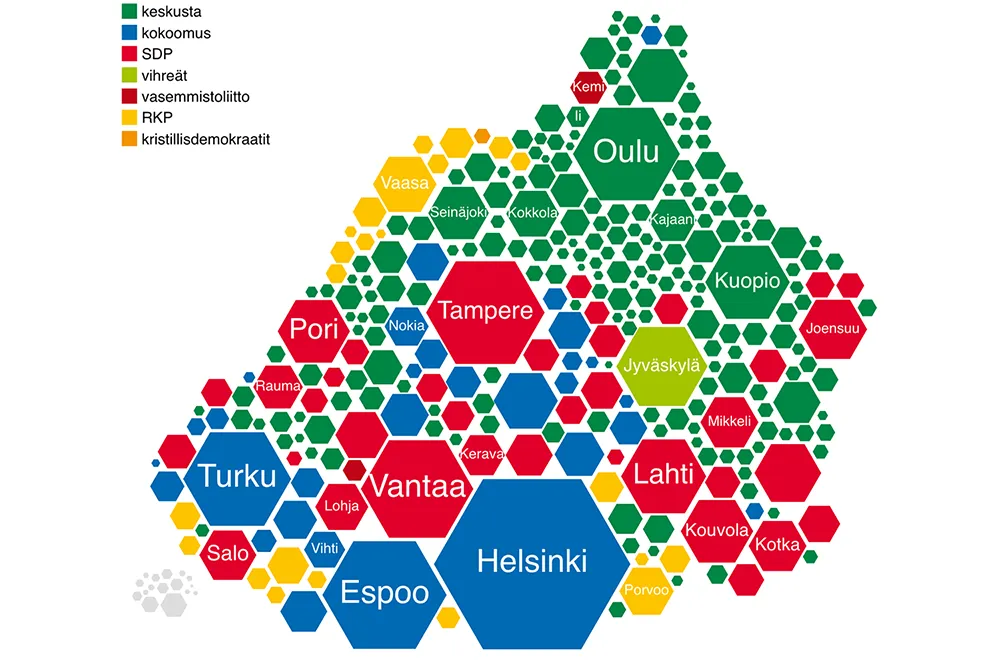
Election map for Aamulehti
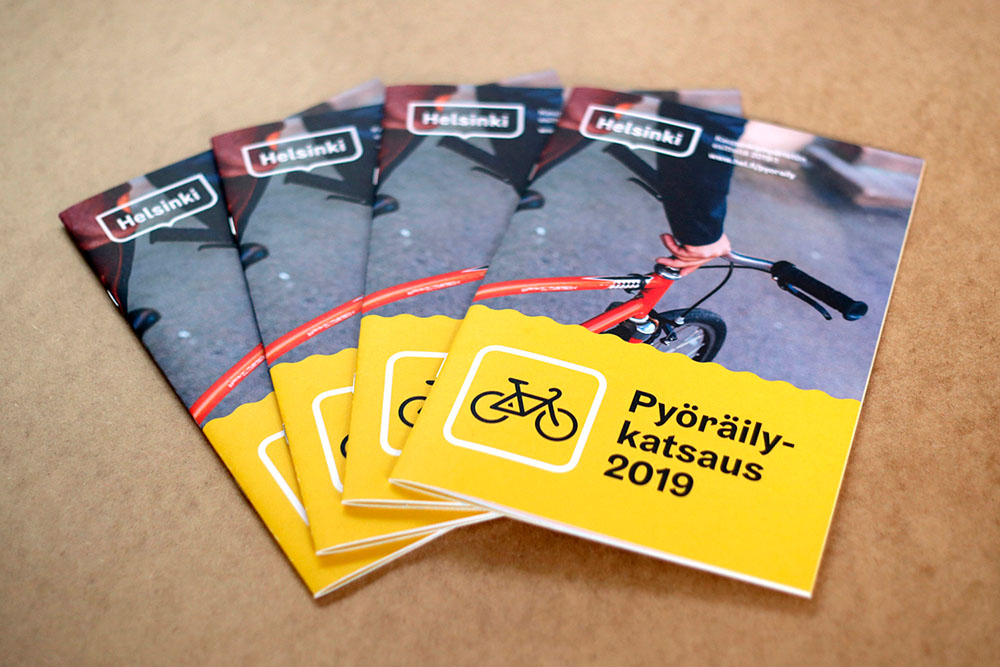
Helsinki Bicycle Account
Interactive visualization for Finnish literature Exchange FILI
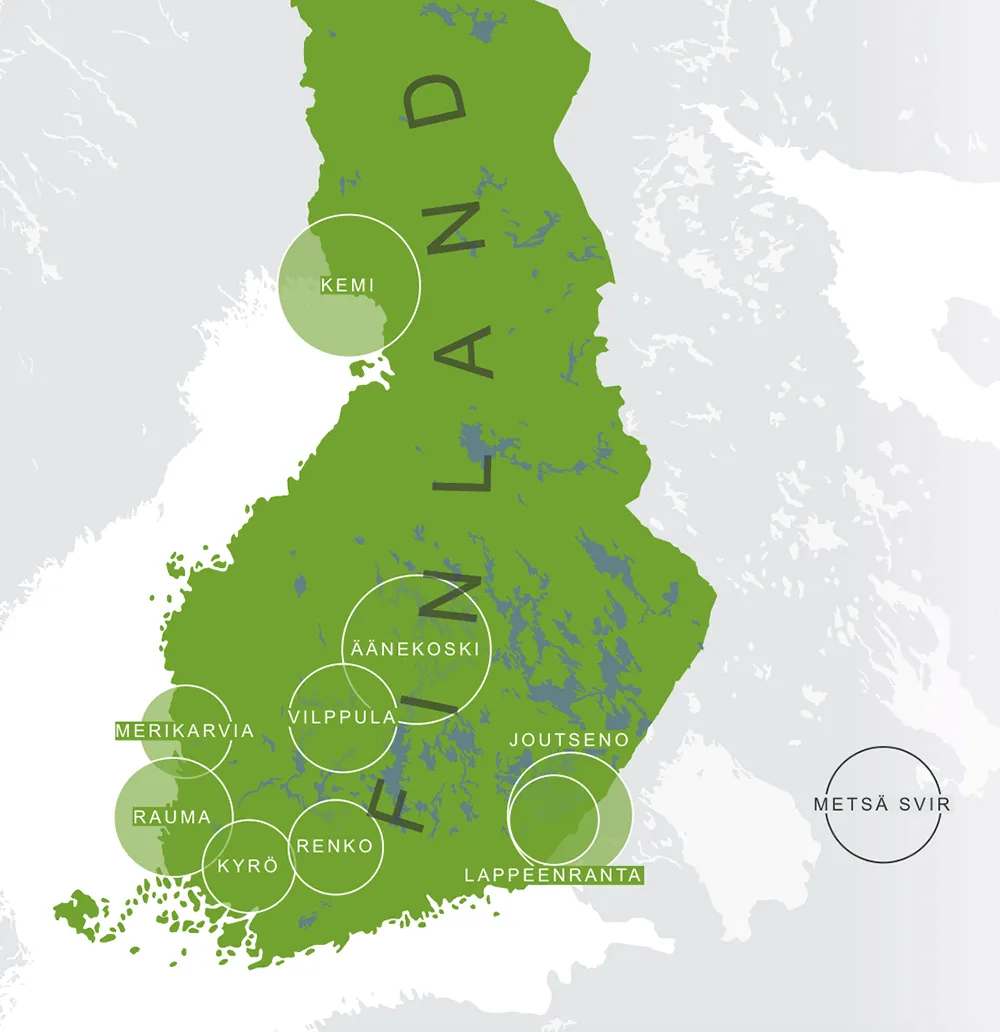
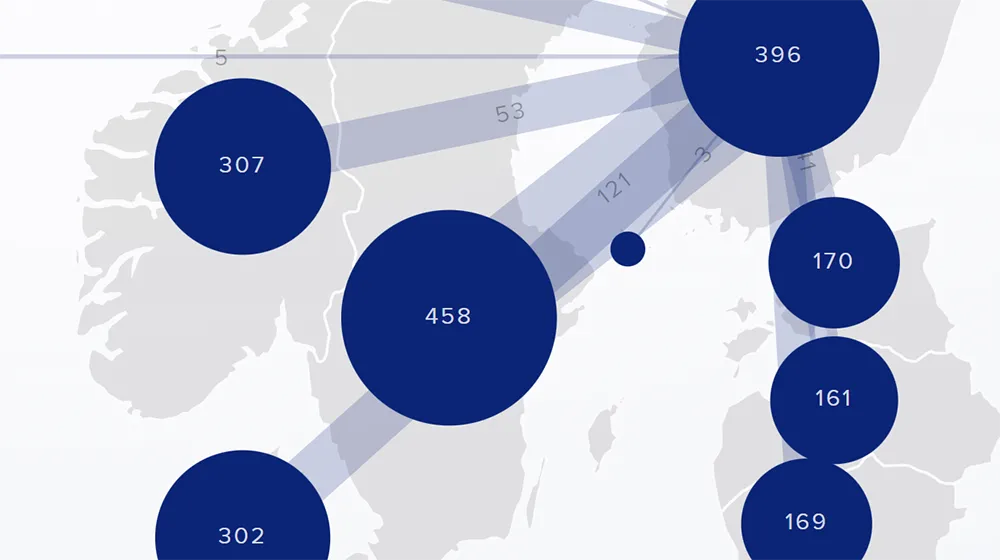
Metsä Fibre annual review
Nordic Culture Point interactive visualization
Books
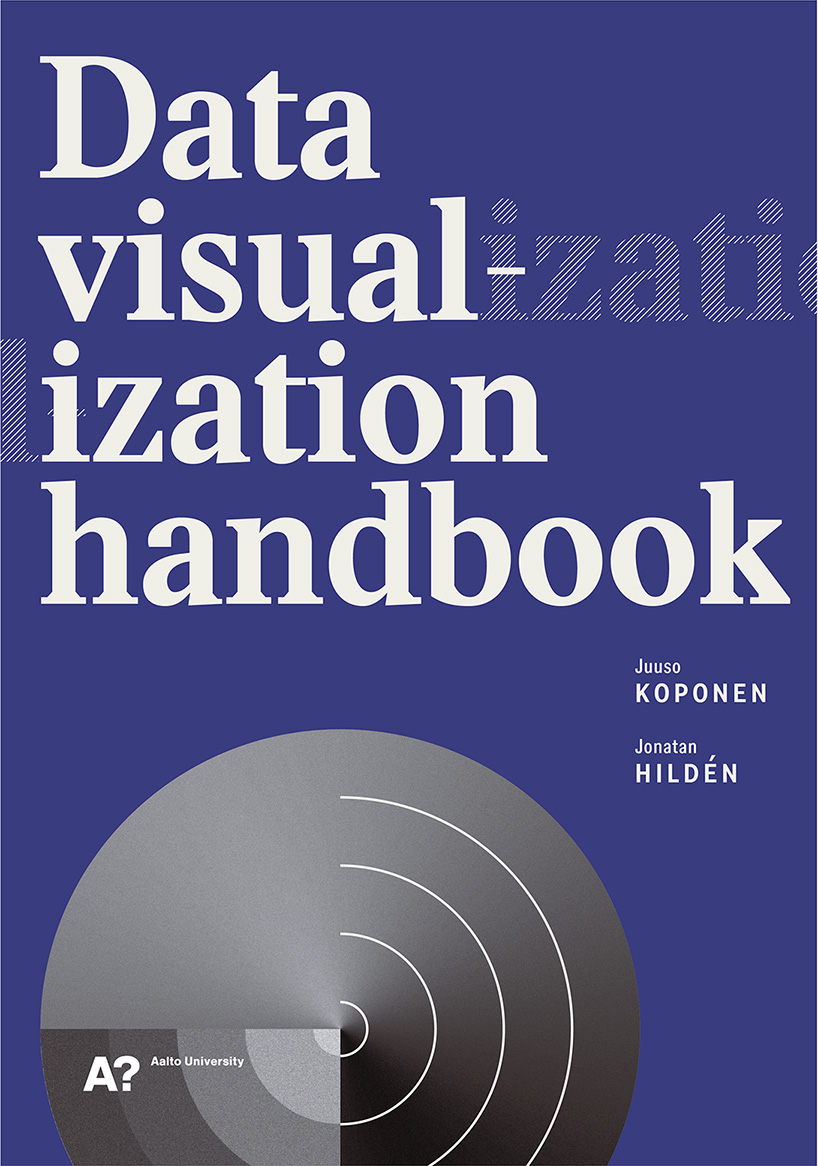
Data Visualization Handbook (2019)
A practical guide for creating clear and compelling data visualizations, based on the Finnish-language original.
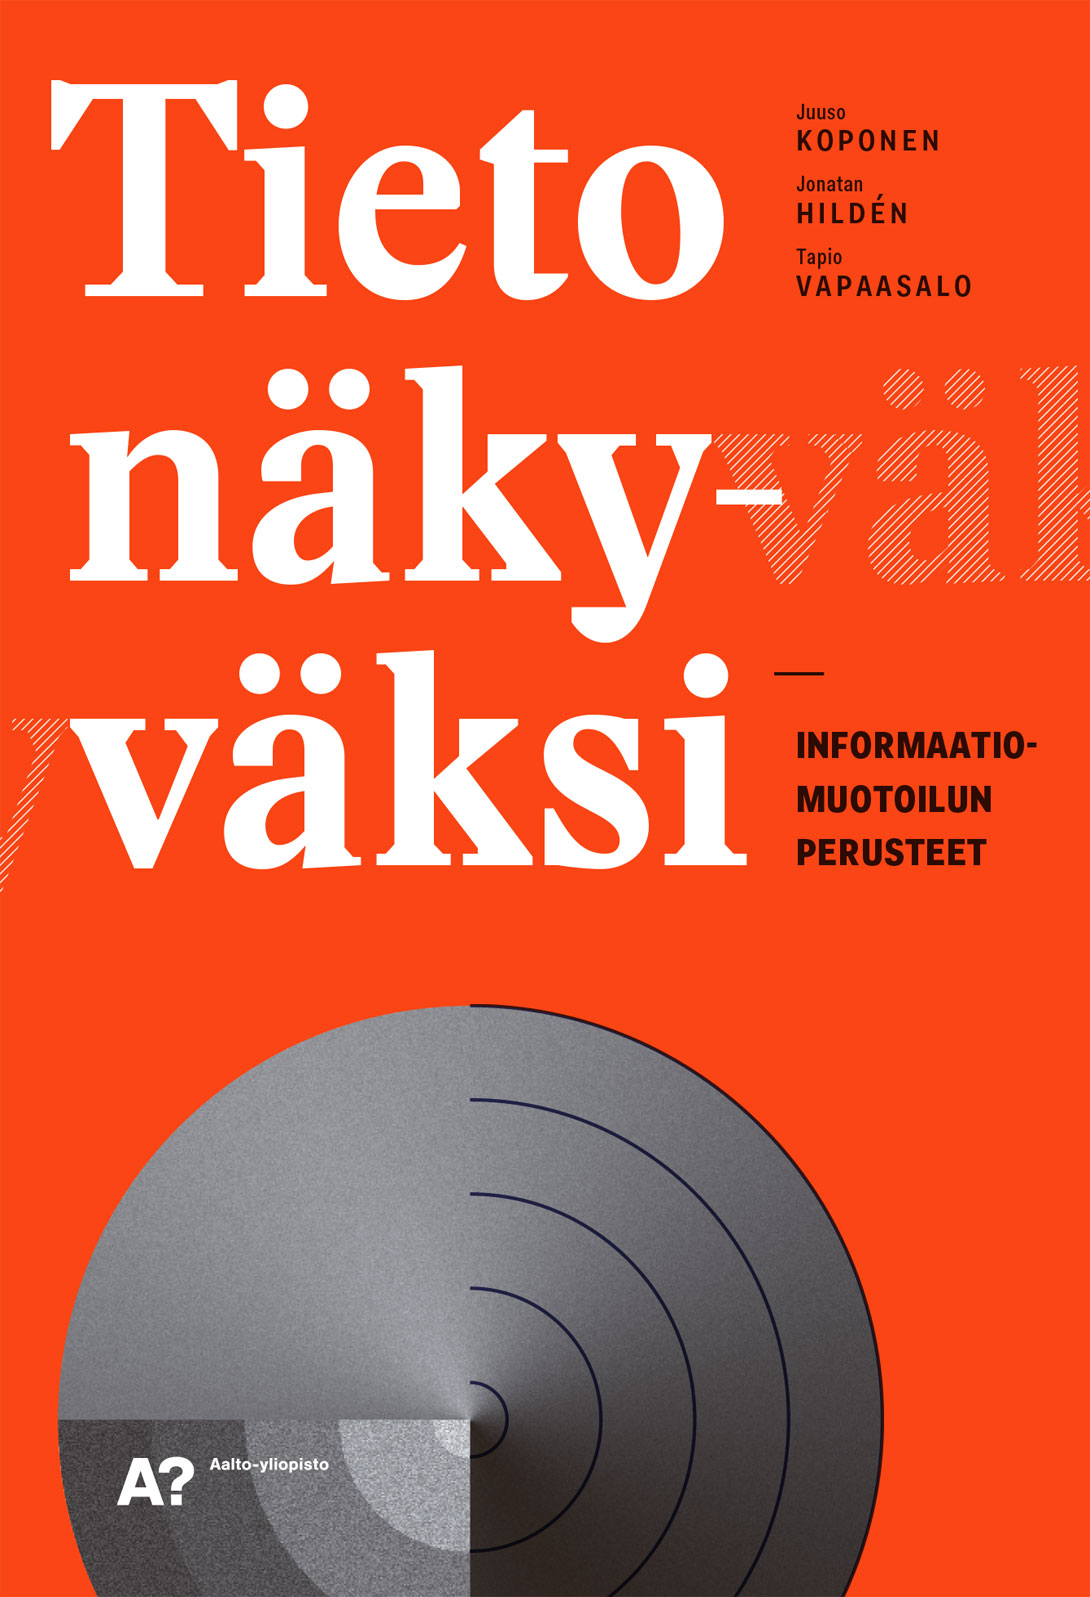
Tieto Näkyväksi (2016)
The original Finnish-language primer on data visualization.

Training
Both of the company’s founders—Juuso Koponen and Jonatan Hildén—are experienced educators. We have taught close to 200 individual courses and workshops during the past decade and a half. We both hold positions as visiting lecturers at several Finnish universities. We offer data visualization training in Finnish, English and Swedish for designers, communicators, researchers, and other experts—with open enrollment or tailored to specific client needs.
For quotes or inquiries please contact Juuso Koponen: juuso@koponen-hilden.fi
Contact
Office
Koponen+Hildén Oy
Hämeentie 19, 00500 Helsinki
visiting address: Käenkuja 3a A
Invoicing
E-Invoice: 003726609535
Operator: OKOYFIHH
VAT ID: FI26609535